
Report
💡 Active projects and challenges as of 22.07.2026 02:21.
Hide text CSV Data Package Print
“Greenify” your preferred open source tool
Choose an open source tool that you love—or that you think could use some love in the sustainability department—and explore how it can be made greener.
Your mission is to analyze, optimize, and advocate for energy-efficient open source software. Pick an open source tool or library where you think your contribution can make a real difference and see if you can do one or more of the following:
- Perform energy measursements using e.g. green-metrics-tool, greenframe or some other form of measurement
- Find areas to improve in regards of efficiency
- Improve the documentation on how to use this tool in a greener way
- work on integrating the Open Energy Badge into the project to raise awareness and showcase your results.
- measure the energy consumption of the CI/CD pipeline
If you don't know where to start, chose one ore more of these challenge variants:
- Blue Slope:
- Create an integration to measure the Energy Impact of the CI/CD pipeline
- Red Slope:
- Install the tool
- Install a measurement tool (e.g. Scaphandre)
- Measure the tool locally with existing or new test cases
- Find hotspots in the code or items in the default configuration
- Submit an issue with the issue or even better, fix the performance problem
- Black Slope:
- Create one or more scenarios for a fullstack measurement (eg greenframe.io / green-coding.io). Measure the tool and create a pull/merge request so that the measurement can be done on a continuous basis for this project
- Implement the Carbon Aware SDK in your software: https://github.com/Green-Software-Foundation/carbon-aware-sdk
- Check for green software patterns and improve on them: https://patterns.greensoftware.foundation/guide/
- Resources:
- Green Software patterns: https://github.com/Green-Software-Foundation/patterns
- Fullstack measurement: greenframe, green-metrics-tool via codespace (click on Code, then Codespace, then "Create Codespace on main")
- CI/CD measurement: https://github.com/green-coding-solutions/eco-ci-energy-estimation
- AI Model measurement: https://huggingface.co/spaces/genai-impact/ecologits-calculator, https://huggingface.co/spaces/jdelavande/chat-ui-energy, http://green-coding.ai/
- An example issue: https://github.com/quartier-depot/self-checkout/issues/9
Sources for Energy Forecasts:
- Entsoe Transparency Platform (EU wide) API docs:
https://transparency.entsoe.eu/content/static_content/Static content/web api/Guide.html - Day ahead and intraday wind and solar power forecost for Switzerland. (Official).
# Carbon Aware DataStore (Zurich Green IT Hackathon Repo)
[](https://golang.org/)
MiniBTreeStore is an experimental key-value (KV) store built in Go, utilizing a B+ Tree data structure for efficient on-disk storage. Its standout feature is a **carbon-aware flushing strategy** designed to reduce the environmental impact of its disk I/O operations.
This project was developed as part of a deep-dive exploration into Green Software Engineering principles, demonstrating how even foundational components like a storage engine can be made more environmentally conscious.
## Quick Start
```bash
# Build the application
go build -o minibtreestore_app .
# Run (Example with carbon-awareness enabled, high intensity start, and visualizer)
./minibtreestore_app -carbonaware=true -mockhigh=true -inserts=500 -buffersize=2 -vizport=:8081 -dir=./test_run_data -interval=1s
Interactive Carbon Intensity Control (During Run)
When the application is running with -carbonaware=true:
Press L (and Enter) in the terminal to set mock carbon emissions to LOW 🟢.
Press H (and Enter) in the terminal to set mock carbon emissions to HIGH 🔴.
Viewing the Frontend Visualizer
After running the backend application with a -vizport specified (e.g., :8081):
# Open this file in your web browser
visualizer/frontend/index.html
The dashboard will poll data from http://localhost:PORT/status (e.g., http://localhost:8081/status).
✨ Features
- Core B+ Tree Operations: Supports Insert, Lookup, and Scan operations. Delete functionality is also present.
- Buffer Management: Implements a buffer manager with an LRU (Least Recently Used) page replacement policy to optimize disk access and improve performance.
- Carbon-Aware Flushing Strategy:
- Monitors (simulated) grid carbon intensity (HIGH 🔴 / LOW 🟢) using a
MockIntensityProvider. - Intelligently defers non-critical disk page flushes when carbon intensity is reported as HIGH.
- Processes the queue of deferred flushes when carbon intensity transitions to LOW, leveraging "greener" energy periods.
- Aims to reduce the effective CO2 footprint of disk write operations.
- Monitors (simulated) grid carbon intensity (HIGH 🔴 / LOW 🟢) using a
- Interactive Carbon Simulation:
- Allows manual toggling of simulated carbon intensity (HIGH/LOW) during runtime via CLI input when
main.gois running with carbon-awareness enabled.
- Allows manual toggling of simulated carbon intensity (HIGH/LOW) during runtime via CLI input when
- Real-time Visual Feedback:
- Enhanced CLI Logs: Detailed console output with emojis (e.g., 🟡 Deferred, 🟢 Low Carbon Flush, ❗Forced Flush) to track the system's carbon-aware decisions and actions.
- Web Visualizer Dashboard: A simple web-based dashboard (
visualizer/frontend/index.html) polls a backend endpoint (/statusfromvisualizer/server.go) to display:- Current carbon intensity status.
- Size of the deferred flush queue.
- Counts of normal, deferred, and forced flushes.
- Buffer pool statistics.
📂 Project Structure
minibtreestore/
├── carbonaware/             # Carbon intensity provider logic
│   └── intensity_provider.go
├── main.go                  # Main application entry point with CLI flags
├── storage/
│   ├── btree/               # B+ Tree implementation
│   ├── buffer/              # Buffer manager implementation
│   └── page/                # Page formats and constants
├── test/                    # Go tests (e.g., store_test.go)
├── util/
│   └── loader/              # CSV data loader utility (if used)
└── visualizer/
    ├── frontend/            # HTML, CSS, JS for the web dashboard
    └── server.go            # Backend HTTP server for visualizer data
🚀 Getting Started (Detailed)
Prerequisites
- Go (version 1.18 or higher recommended)
Build
Navigate to the project root directory and run:
go build -o minibtreestore_app .
Running
The application main.go serves as the entry point and accepts several flags to configure its behavior and the demo workload.
Key Command-Line Flags (see main.go for all):
-dir: Storage directory for B-Tree files (default:./minibtree_data).-buffersize: Number of pages in the buffer pool (default: 100). Try small values like 2 or 5 with high insert counts to observe buffer pressure.-carbonaware: Enable carbon-aware mode (default:false).-carbonregion: Carbon intensity region for simulation (default:"europe-west6").-interval: Interval for the carbon watchdog to check deferred queue (default:30s). Use shorter intervals like1sfor faster demo feedback.-mockhigh: Start with mock carbon intensity as HIGH (default:false, starts LOW).-vizport: Port for the visualizer HTTP server (e.g.,:8081). Set to empty to disable.-inserts: Number of key-value pairs to insert for a demo workload.-btreename: Name of the B-Tree for demo operations.
Example Run (from Quick Start):
./minibtreestore_app -carbonaware=true -mockhigh=true -inserts=500 -buffersize=2 -vizport=:8081 -dir=./test_run_data -interval=1s
🧪 Testing
The test/ directory contains Go tests (e.g., store_test.go). You can run these using standard Go test commands from the root directory:
go test ./...
To test the carbon-aware features interactively, use the command-line flags provided in main.go to set up different scenarios. The CLI logs and web visualizer are key to observing behavior. The "Quick Start" section above provides an example for running and interacting.
📝 Carbon-Aware Simulation Note
This project currently uses a MockIntensityProvider to simulate grid carbon intensity. This is essential for controlled testing and demonstration of the carbon-aware logic. Future work could involve integrating this with real-world carbon intensity data APIs (e.g., from the Green Software Foundation's Carbon Aware SDK, WattTime, Electricity Maps).
Contributors
- Arka Mitra
- Carmen Parra
- Ismail Mohamed Mohamud
- Jeffrey Koppanyi
- Joe Romeo
- Jonas Ward Van den Bulcke
- Raunak Pillai
License
MIT License
Improve an existing Green-IT!
Many existing Green-IT tools are still work in progress and could need some help. Give them this help!
Choose an existing Green-IT tool—like Scaphandre or PowerHog —and make it better! Whether it’s improved usability, more accurate measurements, new integrations, or enhanced visualization—your contribution can push the green software movement forward.
Select a tool from the Green-IT ecosystem (we’ll provide a list of candidates). Explore the codebase and identify areas for improvement. Think about:
- Accuracy: Are measurements reliable across platforms or hardware?
- Usability: Could the UX be more intuitive for developers or sysadmins?
- Performance: Is the tool lightweight and fast?
- Integrations: Could it work better with CI/CD, cloud platforms, or monitoring tools?
- Visualization: Can you present the data in a more accessible or actionable way? Implement, test, and document your enhancements.
If you don't know where to start, chose one ore more of these challenge variants:
- Blue Slope:
- Take a green software tool
- Learn to use it
- improve the documentation. Submit Pull/Merge-Requests
- Red Slope:
- Chose an existing tool and improve the working of the tool an a new or not well supported platform (e.g. port or improve windows support for PowerHog or Scaphandre)
- Black Slope:
- Compare energy metrics of different AI metrics tools:
- https://www.green-coding.ai/
- https://huggingface.co/spaces/genai-impact/ecologits-calculator
- https://huggingface.co/spaces/jdelavande/chat-ui-energy
For a list of great green software have a look here:
codecarbon
Track emissions from Compute and recommend ways to reduce their impact on the environment.

Estimate and track carbon emissions from your computer, quantify and analyze their impact.


![]()
About CodeCarbon 💡
CodeCarbon started with a quite simple question:
What is the carbon emission impact of my computer program? :shrug:
We found some global data like "computing currently represents roughly 0.5% of the world’s energy consumption" but nothing on our individual/organisation level impact.
At CodeCarbon, we believe, along with Niels Bohr, that "Nothing exists until it is measured". So we found a way to estimate how much CO2 we produce while running our code.
How?
We created a Python package that estimates your hardware electricity power consumption (GPU + CPU + RAM) and we apply to it the carbon intensity of the region where the computing is done.
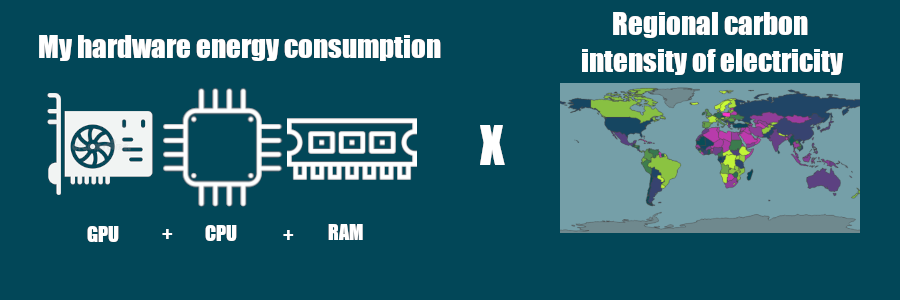
We explain more about this calculation in the Methodology section of the documentation.
Our hope is that this package will be used widely for estimating the carbon footprint of computing, and for establishing best practices with regards to the disclosure and reduction of this footprint.
So ready to "change the world one run at a time"? Let's start with a very quick set up.
Quickstart 🚀
Installation 🔧
From PyPI repository
pip install codecarbon
From Conda repository
conda install -c codecarbon codecarbon
To see more installation options please refer to the documentation: Installation
Start to estimate your impact 📏
To get an experiment_id enter:
! codecarbon init
You can now store it in a .codecarbon.config at the root of your project
[codecarbon]
log_level = DEBUG
save_to_api = True
experiment_id = 2bcbcbb8-850d-4692-af0d-76f6f36d79b2 #the experiment_id you get with init
Now you have 2 main options:
Monitoring your machine 💻
In your command prompt use:
codecarbon monitor
The package will track your emissions independently from your code.
In your Python code 🐍
from codecarbon import track_emissions
@track_emissions()
def your_function_to_track():
  # your code
The package will track the emissions generated by the execution of your function.
There is other ways to use codecarbon package, please refer to the documentation to learn more about it: Usage
Visualize 📊
You can now visualize your experiment emissions on the dashboard.
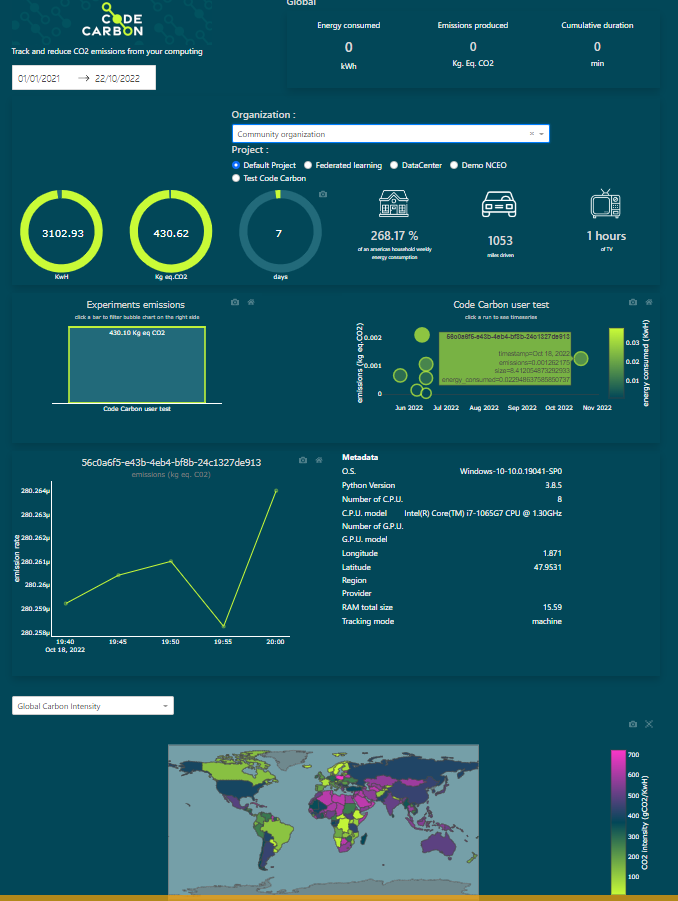
Note that for now, all emissions data send to codecarbon API are public.
Hope you enjoy your first steps monitoring your carbon computing impact! Thanks to the incredible codecarbon community 💪🏼 a lot more options are available using codecarbon including:
- offline mode
- cloud mode
- comet integration...
Please explore the Documentation to learn about it If ever what your are looking for is not yet implemented, let us know through the issues and even better become one of our 🦸🏼♀️🦸🏼♂️ contributors! more info 👇🏼
Contributing 🤝
We are hoping that the open-source community will help us edit the code and make it better!
You are welcome to open issues, even suggest solutions and better still contribute the fix/improvement! We can guide you if you're not sure where to start but want to help us out 🥇
In order to contribute a change to our code base, please submit a pull request (PR) via GitHub and someone from our team will go over it and accept it.
Check out our contribution guidelines :arrow_upper_right:
Contact @vict0rsch to be added to our slack workspace if you want to contribute regularly!
How To Cite 📝
If you find CodeCarbon useful for your research, you can find a citation under a variety of formats on Zenodo.
Here is a sample for BibTeX:
@software{benoit_courty_2024_11171501,
  author       = {Benoit Courty and
                  Victor Schmidt and
                  Sasha Luccioni and
                  Goyal-Kamal and
                  MarionCoutarel and
                  Boris Feld and
                  Jérémy Lecourt and
                  LiamConnell and
                  Amine Saboni and
                  Inimaz and
                  supatomic and
                  Mathilde Léval and
                  Luis Blanche and
                  Alexis Cruveiller and
                  ouminasara and
                  Franklin Zhao and
                  Aditya Joshi and
                  Alexis Bogroff and
                  Hugues de Lavoreille and
                  Niko Laskaris and
                  Edoardo Abati and
                  Douglas Blank and
                  Ziyao Wang and
                  Armin Catovic and
                  Marc Alencon and
                  Michał Stęchły and
                  Christian Bauer and
                  Lucas Otávio N. de Araújo and
                  JPW and
                  MinervaBooks},
  title        = {mlco2/codecarbon: v2.4.1},
  month        = may,
  year         = 2024,
  publisher    = {Zenodo},
  version      = {v2.4.1},
  doi          = {10.5281/zenodo.11171501},
  url          = {https://doi.org/10.5281/zenodo.11171501}
}
Contact 📝
Maintainers are @vict0rsch @benoit-cty and @SaboniAmine. Codecarbon is developed by volunteers from Mila and the DataForGoodFR community alongside donated professional time of engineers at Comet.ml and BCG GAMMA.
Star History
Comparison of the number of stars accumulated by the different Python CO2 emissions projects:
SustainaBit Navigator
Develop a sustainability checklist for IT projects to incorporate sustainability in all phases of the project
Develop a sustainability checklist for IT projects focusing on these three stages of a project: Pre-project phase, project execution, project closure.
The checklist should support decision making in all three phases and ideally guarantee an effective success measurement throughout the three phases:
- In the pre-project phase the checklist should help to set-up the project in a sustainable way (e.g. Required certifications in case of an IT Hardware project, coding principles in case of a software project, hosting in a low-carbon-intense country…).
- In the project execution phase the checklist should help to identify potential pitfalls (e.g. identification of resource intense calculations, “sustainable” UI design principles…).
- In the project closing phase the checklist should help to define which measurement setup should be thought of and what re-occuring checks should be considered.
Pain:
IT Projects generally just focus on the successful implementation without considering sustainability aspects. There are various sustainability aspects during each of the three phases, so it is important to focus just on a few in order to not disrupt too much the main objective of the IT project. Stakeholder: Project Management Office & CIO
Context:
Depending on the type of IT project (software development, software implementation, infrastructure setup…) the impact and the sustainability measures can vary Consider the effort-output-outcome-impact ratio to not impede the objective Consider also projects with the involvement of “externals” (software vendors, consultants…)
Output:
- Word/Powerpoint or equivalent
- In a chosen project management tool
- Slido/Mentimeter or other real-time assessment tool
- Nocode/low-code Rule engine
- Web app as MVP for SUS IT Project Navigator
Resources:
- Climate Product Leaders Playbook
- Green Software Maturity Matrix
- Exove - Green IT Purchasing Guide (PDF)
- UNICEF Sector-Wide Sustainability Check Tool
- ITU - Assessment framework for environmental impact of ICT
Work in progress
Develop a sustainability checklist for IT projects II
Develop a sustainability checklist for IT projects at ELCA for all phases of projects inception, construction, deployment, run & maintenance
Develop a sustainability checklist for IT projects focusing on these three stages of a project: Pre-project phase, project execution, project closure.
The checklist should support decision making in all three phases and ideally guarantee an effective success measurement throughout the three phases:
- In the pre-project phase the checklist should help to set-up the project in a sustainable way (e.g. Required certifications in case of an IT Hardware project, coding principles in case of a software project, hosting in a low-carbon-intense country…).
- In the project execution phase the checklist should help to identify potential pitfalls (e.g. identification of resource intense calculations, “sustainable” UI design principles…).
- In the project closing phase the checklist should help to define which measurement setup should be thought of and what re-occuring checks should be considered.
Pain: IT Projects generally just focus on the successful implementation without considering sustainability aspects. There are various sustainability aspects during each of the three phases, so it is important to focus just on a few in order to not disrupt too much the main objective of the IT project. Stakeholder: Project Management Office & CIO
Context: Depending on the type of IT project (software development, software implementation, infrastructure setup…) the impact and the sustainability measures can vary Consider the effort-output-outcome-impact ratio to not impede the objective Consider also projects with the involvement of “externals” (software vendors, consultants…)
Output:
- Word/Powerpoint or equivalent
- In a chosen project management tool
- Slido/Mentimeter or other real-time assessment tool
Resources:
Pitch to your management an emission reduction programme for IT
Develop an approach to convince your management of the key actions to reduce your IT emissions.
Pain: Technology has a footprint within any organisation, typically from user devices (mobiles/laptops), data centers and cloud. Many IT leaders are unaware of the impact of the technology they manage, despite their companies developing sustainability strategies at a global level. Help your IT leadership understand how they can take action to reduce the impact of IT, and what other benefits they may see from this.
Stakeholders: CIO / CSO
Context:
- Depending on your industry, technology has a different materiality (importance for sustainability)
- Consider other priorities within IT: Cost, Security, User Experience/Productivity
- Consider the effort-output-outcome-impact ratio
Outcome:
- Powerpoint or similar
Resources:
Develop a quick-start-guide for Green IT in your office/team/company
Develop a practical and easy-to-follow Quick-Start Guide that helps to integrate sustainability into your IT operations
Many struggle with implementing Green IT due to a lack of awareness, clear guidelines and time pressure. This challenge focuses on developing a practical and easy-to-follow Quick-Start Guide that helps teams, offices, or companies to integrate sustainability into their IT operations. The guide should provide the business case for Green IT, actionable steps, best practices, and SMART goals to ensure energy-efficient, cost-effective, and environmentally responsible IT usage.
Pain: Shifting to sustainable practices may face resistance due to established routines, the need to change existing workflows and often requires significant upfront costs and time investment.
Stakeholder: Team Leader / Management
Context:
Your IT may or may not already have Green IT initiatives in place. Assume that there aren’t any initiatives yet, and your guide should be for your team(s) Or a guide for a specific topic such as Web-Dev Company, IT-Ops company, Internal IT
Potential starting points:
- https://club.greenit.fr/referentiel.html (In English Auto-Translated with Google)
- https://collectif.greenit.fr/ecoconception-web/
Output:
Resources: